Quality Control KPIs in Manufacturing

As the saying goes, you can’t improve what you don’t measure.
This is the idea behind all process excellence frameworks from Lean to Six Sigma, DMAIC to ISO 9000.
In manufacturing, tracking quality control key performance indicators (KPIs) or performance metrics is central to the driving goal of quality management: minimizing defects and meeting customer expectations.
In this guide, we cover:
- The benefits of tracking quality control KPIs in manufacturing process
- The difference between quality assurance and quality control, and why it matters
- Examples of quality control KPIs
- How process audits help improve your most important quality control KPI
Learn more about how to reduce cost of quality with our free white paper on Cost of Quality: The Truth About Your Ultimate Quality Metric.
The Importance of Quality KPIs in Manufacturing
Measuring quality KPIs in manufacturing is a central factor in driving continuous improvement. KPIs provide actionable insights into the production process that help manufacturers to:
- Track performance against targets
- Uncover process issues and bottlenecks
- Identify problems early and determine appropriate corrective actions
- Improve customer satisfaction
Continuous monitoring of quality control KPIs helps ensure products meet standards as well as customer expectations. They provide crucial information on the quality of the process itself, the quality of production outputs and the customer experience. In tracking these metrics, teams can reduce complaints, recalls and quality costs, all while increasing profitability.
From a larger perspective, quality control KPIs in manufacturing align teams around a set of common goals and benchmarks. The idea here is that when everyone on your team understands the key metrics of success, the result is improved collaboration and a culture of quality.
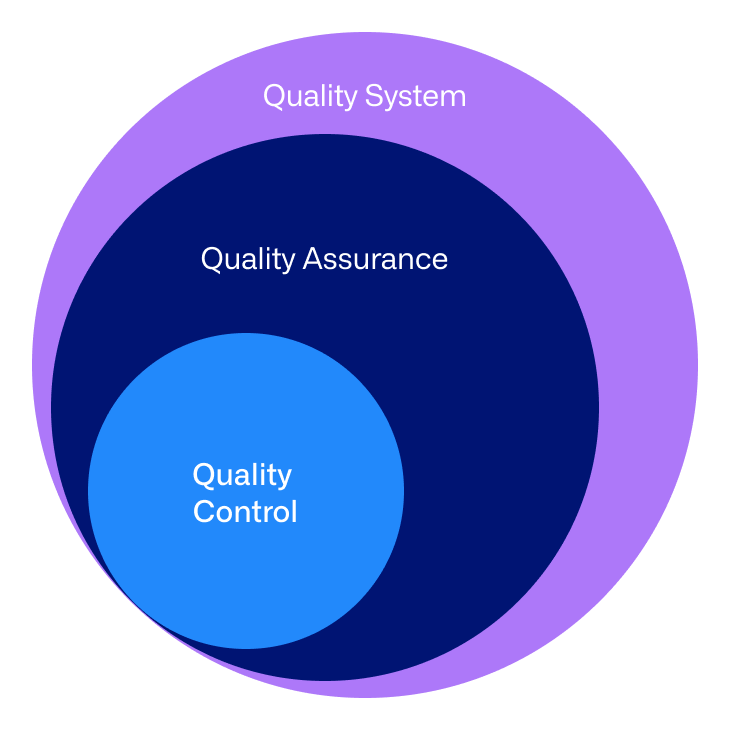
Quality Assurance vs. Quality Control
Many people use the terms quality control and quality assurance interchangeably. In reality, the two terms have different meanings and cover different (but often related) activities. Later in this article, we’ll discuss quality assurance KPIs in manufacturing, so before we jump into quality control KPIs, it’s important to understand the difference between the two.
ISO 9000 defines quality control as a subset of quality assurance, both of which are encompassed under the quality system as a whole.
Quality Assurance Definition
The American Society for Quality (ASQ) defines quality assurance as “all the planned and systematic activities implemented within the quality system that can be demonstrated to provide confidence that a product or service will fulfill requirements for quality.”
The key here is that quality assurance is about building confidence into the system that you will fulfill quality requirements, both internally for the company as well as to external parties such as customers, regulators and auditors.
Quality Control Definition
Conversely, ASQ defines quality control as “the operational techniques and activities used to fulfill requirements for quality.”
An illustrative example here would be to compare auditing (a quality assurance technique) against inspection (a quality control technique). Inspections look at finished product characteristics to determine whether they meet specifications and requirements. Audits, on the other hand, look upstream at process inputs such as operator behavior, machine settings and 5S compliance to verify that conditions support a high-quality output.
Examples of Quality Control KPIs in Manufacturing
Manufacturers use a vast array of quality control KPIs that can be unique to their industry, product or process. Note, however, that all of these metrics reflect a single underlying goal: producing fewer bad parts.
With that in mind, we start below by examining some examples of defect and scrap metrics. These numbers, in turn, have a corresponding impact on other types of KPIs, such as:
- Productivity and efficiency metrics: When you produce fewer bad parts, productivity and efficiency both go up.
- Customer satisfaction metrics: When you ship more good parts, customer satisfaction also increases.
- Cost of quality: Reducing waste both in terms of materials and the time and effort needed to address problems helps reduce cost of quality.
Defect and Scrap Metrics
There are numerous ways to measure how many bad parts are coming out of your plant, and each site may spin them a little differently based on their unique needs and processes.
| KPI | Definition |
| Scrap rate | The percentage of materials that must be discarded because they are defective or unusable |
| First pass yield | Also called throughput yield. Percentage of parts that meet inspection the first time without needing rework. |
| Rejection rate | The percentage of products rejected upon inspection due to product defects |
| Nonconformities | Number of instances where a product fails to meet quality standards |
| Parts per million (PPM) or defects per million (DPM) | Internal measure of the number of defects expected in a sample of one million units, projected out from a smaller sample set |
| Customer complaints | The number of complaints received from customers related to product quality issues |
| Warranty costs | Total expenses to repair or replace defective products that are under warranty |
| Active defects | Number of defects currently in production or in the field |
| Rejected defects | Number of defects that were identified and rejected in the inspection process |
| Defects fixed per day | Number of defects corrected in a day |
Supplier Quality Metrics
Supplier quality plays a major role in the quality of end products and customer satisfaction. The truth is that customers will hold you accountable for defective products, whether or not the problem originated from your plant.
Supplier quality metrics to monitor align closely with defect and scrap KPIs:
- Supplier defect rate
- PPM
- Non-conformance reports (NCRs)
- Number of supplier corrective action requests (SCARs)
- Average time to SCAR closure
- CoPQ from supplier
- Warranty claims due to supplier-related defects
- FPY of supplier parts
- On-time delivery
- Supplier lead time
Productivity and Efficiency Metrics
Quality teams often track KPIs related to productivity and efficiency, but it’s worth noting that many of these are correlated with defect rates. Having to scrap or rework a batch represents waste that eats into productivity and efficiency, as well as profitability.
| KPI | Definition |
| Overall equipment effectiveness (OEE) | A measure of how well a machine performs compared to its capacity, based on availability, performance and quality rate |
| Manufacturing cycle time | The total time it takes to manufacture one unit |
| Capacity utilization rate | Also called operating rate, this measures a plant’s output relative to its potential |
| Labor utilization rate | How efficiently a plant uses its workforce for production. Labor utilization rate is calculated by dividing the total number of productive hours by the total number of hours worked. |
| Lead time | The time it takes to fill customer orders |
| Takt time | The rate at which you must produce parts to meet customer needs |
Customer Satisfaction Metrics
The entire purpose of quality management is to meet the needs and expectations of customers. Thus, metrics that look at quality from the customer’s perspective are critical to track in terms of measuring the effectiveness of quality control.
Again, many of these are directly correlated with defects, underscoring the fact that reducing defects is the fundamental purpose of quality control.
Customer satisfaction metrics that quality teams may track include:
- Customer satisfaction scores: How customers rate your products
- Perfect order fulfillment rate: Percentage of orders that customers receive without incidents.
- On-time delivery rate: Percentage of orders that customers receive on time
Cost of Quality
Most companies do not have a full grasp of their quality costs. That said, quality costs—a function of variation in the process and defects—directly affect the bottom line.
Cost of quality can be broken down into two main categories:
- Cost of poor quality (CoPQ), which includes internal and external failure costs
- Cost of good quality (CoGQ), which includes prevention (a quality assurance activity) and appraisal or inspection.
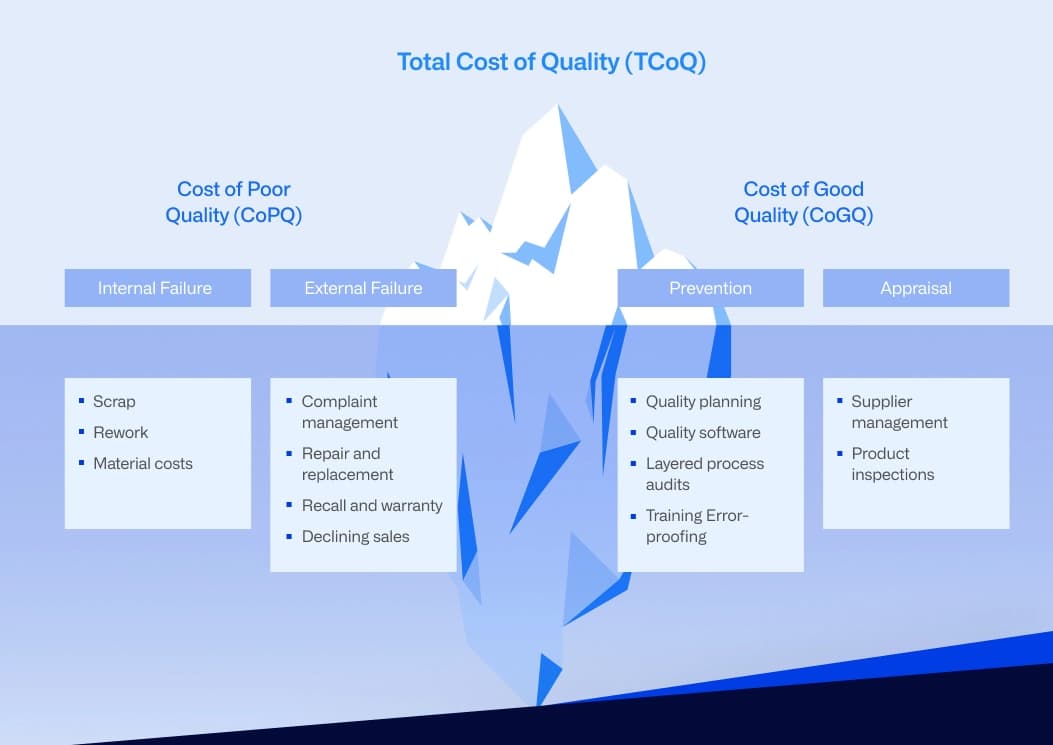
As defects go up, so do CoPQ and appraisal costs. As defects go down, quality costs also go down due to reductions in scrap rates, material costs and warranty costs.
Leading Metrics vs. Lagging Metrics
Any discussion of quality control and quality assurance KPIs in manufacturing must necessarily explore the difference and importance of using leading versus lagging metrics.
The difference is a meaningful one: Lagging metrics focus on past performance, whereas leading metrics are those that correlate with changes in lagging metrics.
Examples of lagging metrics include output measures like defect rates, scrap and customer complaints. In your plant, you might observe that increasing the volume of plant floor audits correlates with fewer defects.
Thus, tracking the number of monthly audits as a leading indicator of defects can allow you the opportunity to step in and make corrections when your monthly audit volume is going down, before it leads to an increase in defects and complaints.
Quality Assurance KPIs in Manufacturing
Where many quality control KPIs are lagging metrics, quality assurance KPIs are often leading indicators of quality performance. So while quality control metrics like scrap, OEE and quality costs often take priority, tracking quality assurance KPIs is also vital to maximizing the impact of your quality efforts.
Recall the definition of quality assurance, which focuses on providing confidence that the system is built to deliver high-quality products that will meet requirements consistently. This is by definition proactive in that it looks at the activities and controls to prevent problems, such as employee training, plant floor audits and corrective action systems.
Quality assurance KPIs also help gauge the overall effectiveness of the quality system, looking at items such as:
- Audit metrics: When conducting plant floor process audits, you might look at metrics like audit completion rate and process non-conformances by failure type or work area. Tracking the number of 5S audit findings is another example of how audit metrics can point to where you are most likely to have quality issues.
- Corrective action metrics: KPIs such as number of open corrective action requests or number of corrective actions over 45 days old can give you a sense of how efficiently you’re solving problems.
- Employee training metrics: Looking at KPIs like average number of training hours completed or number of overdue training modules by employee can provide insight into potential workforce training gaps.
- Cost of Good Quality (CoGQ): How much are you spending on things like quality planning, quality software, plant floor audits and error-proofing? Tracking expenses associated with cost of good quality (CoGQ) can tell you whether you’re underinvested in quality and thus likely to face quality issues in the future.
Using a Quality Management System (QMS) to Monitor and Improve KPIs
ISO 9001 for quality management systems strongly emphasizes performance evaluation (Clause 9) and improvement (Clause 10). Manufacturers that certify to this widely recognized standard are required to collect and analyze data to evaluate elements such as:
- Conformity of products
- Customer satisfaction
- QMS effectiveness
- Supplier performance
Automated quality management system (QMS) tools have played a large role in digital transformation in manufacturing organizations today. Some companies use an enterprise QMS that integrates multiple tools such as document management, employee training, audits and corrective action.
Others may use point solutions that provide deep functionality in a specific area according to their specific requirements, such as on-the-job training capabilities, regulatory tracking or specialized audit solutions. Companies may link these solutions to each other, to an enterprise QMS and/or business systems like ERP and MES using application programming interfaces (APIs).
Using Layered Process Audits to Drive KPI Improvement
The vast majority of quality control KPIs in manufacturing are focused on one thing: reducing defective parts. Whether it’s metrics like scrap rate and customer complaints or productivity and efficiency measures like OEE, all of these are closely related to defect rates.
Layered process audits are a high-frequency auditing method used in industries like automotive, aerospace and more as a focused approach to reducing variation that leads to defects. What makes layered process audits powerful is that they:
- Take place daily or every shift to more proactively catch issues and build reliability into the system
- Involve multiple levels of management who bring fresh eyes to the process
- Focus on upstream process inputs such as the 6Ms to ensure that the process meets standards and thus will result in a high-quality product
Layered process audits are a cost-effective tool for driving change in quality control KPIs simply because they are laser-focused on reducing variation in process inputs. That, in turn, helps improve scrap-related metrics, whether it’s reducing internal PPM or increasing first-pass yield.
The Secret Ingredient in LPA Success
Of course, managing daily or shift-level audits involves a lot of administrative time if you’re using pen and paper or spreadsheets. Companies that are most successful with layered process audits are those that leverage plant floor audit software to minimize this administrative burden with tools like:
- Automated scheduling and reminders to boost audit compliance
- Dynamic question libraries to rotate and randomize audit questions without having to create, print and distribute new checklists
- Real-time reporting showing process failures by department
- Closed-loop issue tracking to monitor the resolution of problems identified on the plant floor
Simplifying the administrative end of these audits is what allows you to focus on what the data is telling you, rather than collecting, entering and processing that data.
How Quality Assurance and Quality Control KPIs Work Together: A Success Story
A Fortune 500 automotive supplier conducting LPAs in a windshield wiper plant was facing complaints over parts breaking down in the field. The company had previously used LPA software but had issues with scheduling and reporting, leading them to fall back on spreadsheets to manage their LPA process.
Because of the inherent difficulties of managing frequent audits with spreadsheets, they decided to implement EASE plant floor audit software. Making the switch allowed them to:
- Schedule and track roughly 500 audits each month for a team of 80
- Verify that new steps added to the process were being followed on a daily basis
- Include visual standards in audit questions to clarify what conforming parts look like
As a result of increasing the volume of their process audits, the manufacturer was able to eliminate recurrence of the defect, delivering a full 50% reduction in quality costs.
In a world where customers expect zero defects, effectively tracking and improving on quality control KPIs can give manufacturers an edge over the competition. While there is an endless proliferation of metrics that companies track, they all align around quality control’s central goal of reducing defects.
Reaching this goal requires intense focus on process failures that are the underlying cause of a large percentage of defects, complaints and costs. Automated QMS tools such as plant floor audit software provide a key advantage in this pursuit by eliminating inefficiencies in manual quality processes. In doing so, companies can improve productivity while achieving fewer defects, happier customers and a healthier bottom line.
